
SUM() function is a Power BI DAX mathematical function that adds up all the values in a single column that you specify after applying all filters.
It can not perform row by row evaluation like SUMX() function.
It returns a decimal number.
DAX SYNTAX
SUM(<column>)
<column> is a column that contains the numbers to sum.
Lets go through an example to see SUM() function in action.
Here we have a sample table SupplierMaster which contains the data supplied by supplier as given below.

Suppose, you want display the total quantity supplied by an individual supplier then you can use SUM() function.
Creating a measure to calculate the total sum of quantity
TotalQtySum = SUM(SupplierMaster[Quantity])

As you can see, it returns a sum of total quantity for individual supplier.

Sum with CALCULATE function
Suppose, you want to display sum of quantity only for a specific category.
Lets say to calculate the total quantity for category “Laptop” then you need to filter out the data for category “Laptop” then calculate the sum of quantity.
In this case you can use CALULATE function as given below.
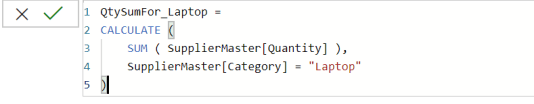
QtySumFor_Laptop =
CALCULATE (
    SUM ( SupplierMaster[Quantity] ),
    SupplierMaster[Category] = "Laptop"
)
After creating a measure, you can see the output.
A left table displays a total quantity by Supplier by Category for category “Laptop” and right table displays the total quantity for each supplier for category “Laptop”.

Also Read..
![]()