
Power BI August 2020 update has released a new feature Import text using examples, which allows you to import text/csv file which allows you to specify sample output values for the data you would like to extract from your Text/CSV file.
Basically, this feature writes the Power Query steps to transform a non-tabular or unstructured text/CSV file into Power BI.
Lets demonstrate the ability of this feature step by step, first you need to enable this feature in your Power BI Desktop as shown below.
Make sure you must be using at least august 2020 version of PBI desktop.
In Power BI Desktop, click on File, then click Options and settings and select Options.


Once you click Options, a Option dialog box opens.
Now click on Preview features, and tick the check box Import text using examples.
After that click on OK button.

Lets see the sample text file named ItemDetails, you can see the data in this file is unstructured format, means it not a valid tabular format, and our requirement is to transform this data into tabular format.

#ItemDetails
=======================
1
Iphone 5S
35000
Sliver
=======================
2
Iphone 6
45000
Glod
=======================
3
Iphone 7
50000
Black
=======================
4
Iphone 7
55000
Glod
=======================
5
Lets, load this unstructured data file into Power BI desktop using a Import text file using examples features.
Go to Power BI ribbon bar, click on Get data and select a data source Text/CSV.

Now browse your text file to Power BI desktop, after that you will see a preview of your file.
You can see that all the data in file is loaded into single column that is column1 as it is unstructured format, so that you want to transform this data into table format.
Next, click on Extract table using Examples button.

After clicking, you will see a Extract Table Using Examples dialog box opens.

Now you have to specify a value for your data that you want to extract from text file.
Before proceeding further, just take a look on below sample data of text file.
=======================
1
Iphone 5S
35000
Sliver
=======================
So transforming this data into table, Lets say first value that is 1 that you want to show in first column of table, Lets give it a name ItemId.
Again, the value Iphone 5S that you want to show in second column that would be value for ItemName column.
Next the value 35000, you want to show in third column of table that would be a value for Amount column.
And the last value Silver would be fourth column of table, that is value for Color column.
Lets start to extract a data from text files based on values, first provide a name for the first column, Just double click on column header column1 to rename the column to ItemId.
Now in first cell, just start typing 1 and you can see it suggests all the possible values for ItemId column.

Now select 1 from auto suggested list and you will see that all the values are automatically filled for column ItemId.

You can see, In ItemId column some other values are also coming such as Iphone 5s , 35000 and many other values, so you need to specify values for ItemId column one more time to filling the remaining correctly.
Lets, go to second row of ItemId column and just type 2 as that should be a second value for ItemId, and select it from suggested list.

Once you select the value 2 into second row for column ItemId. You will see this time all the value for ItemId columns are extracted from text file correctly.

Now time to add a next column ItemName in table, Lets extract the values from text file based on specified values for this column.
Now in ItemName column, we know that for ItemId =1, the ItemName value is Iphone 5s.
So just start typing the Iphone 5S in the cell of ItemName column, and select the Iphone 5S from auto suggested lists.

Once you select Iphone 5S for ItemName, you will see all the values for ItemName against each ItemId are extracted automatically.

So far, we have successfully transform a table from the unstructured data, now table which contains two columns ItemId and Itemname.
Now we have to add two more columns that is Amount, and Color.
Similarly, will repeat the same steps, Add new column and named it as Amount, and just type in a value 35000 that is the amount for ItemId =1, and select a value from suggested lists to fill all the amount values for Amount columns automatically.

Once you select the amount 35000 from suggested lists, you will see all the values for amounts are extracted from text files and filled into Amount column.

Lets quickly repeat the same steps for Color.

Once you select the color Sliver from suggested lists, you will see the all the values for color are extracted from text file.
Now we have transformed all the non tabular/unstructured text file data into valid table format.
Now you can either Load this data into Power BI Desktop or can Transform to make any changes such as datatype or other.
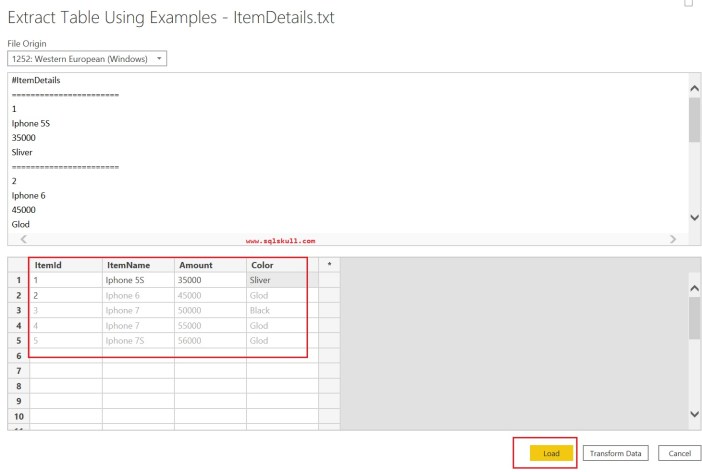
Here, we click on Load to data into Power BI.
Now, Lets go to Power Query Editor, and you can see the data, Also you can see all the steps which are taken to transform text file data.

Also Read..
Group By the data using Power Query
Create Index column using Power Query
![]()