
Creating a Report tooltip page in Power BI
Power BI allows us to create a report tooltip pages, means you can access a report page inside tooltip.
So for any selected records on visuals you can display more information by displaying a report page as a tooltip.
Following are the step by step implementation of creating a Report tooltip page in Power BI.
Here we have a report page country, that displays the sales data country wise price of products.

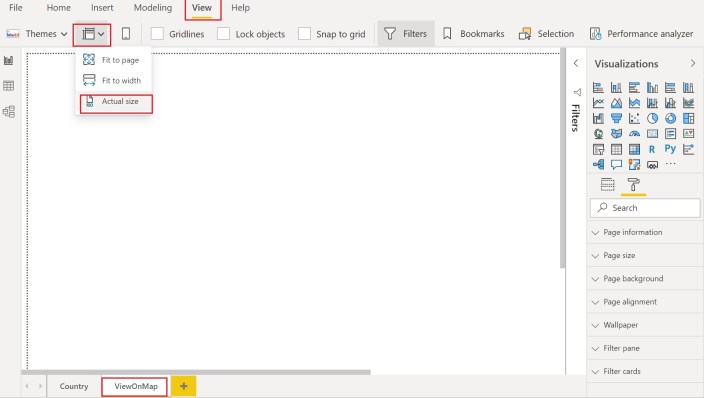
Lets create a report tooltip page named it as ViewOnMap
Go to ribbon bar, Click on choose a page view icon then select Actual Size
After that, Go to page Format Section, then Set page size type to Tooltip

Now click on Page Information property in Format section, give a name to Page, if you have not given yet also enabled Tooltip .

Lets take a MAP visual on report tooltip page ViewOnMap, Go to visualizations Pane select MAP visual,
then drag fields to field pane that you want to display on MAP.

Now go back to report another page that is country page.
Go to chart visual Format section, enable tooltip property.
Select Type as Report Page, and in Page property select tooltip page that you want to display for visual, Here we have one tooltip page that is ViewOnMap.

Now just hover the mouse on bar chart, you will see a MAP visual appears in tooltip for selected record on bar chart.

To get more information on Report tooltip pages, you can refer microsoft documentation- URL
Power Bi Dynamic Page Navigation
Create Index column using a Power Query
![]()