
What if Parameter gives you the ability to transform data dynamically. Using this you can easily evaluate you data behaviour under different conditions dynamically.
Lets say for below given Sales data table, you want to see how your sales amounts are affected after applying various discount.

You can simply, create a What if parameter to pass the discount value dynamically to the Amount Measure which is being used to calculate sales amount to see the affected amount after applying certain discount.
Lets click on Modeling Tab in Ribbon Bar, then Select New Parameter as shown below.

After clicking on New Parameter, a What-If parameter dialog box open.
Now you need to provide a details for Parameter as following:
Name: provide the name for parameter.
Datatype: data type for values in parameter.
Minimum, and Maximum value: specify the minimum and maximum value for parameter.
Increment: this is how much the parameter will adjust when interacted with in a report.
Default: is a default value for parameter.
Add Slicer to this Page: when this is checked, It puts a slicer with your what-if parameter onto the current report page automatically.
After providing details click on Ok Button.

Once you click on Ok button, a slicer is created on report page with values (minimum to maximum) that you assigned to parameter.
Values will be incremented by 1 up to the maximum value on scrolling slider to right side.

Also a What if parameter is created in data model. It contains a Parameter, and Measure. Both the parameter and the measure become the part of data model.

Parameter is that returns a single column table containing the values ( minimum 1 to maximum value 20).
It is used to show the values into visual, the slicer on report page is using the Parameter to displaying the values from 0 to 20, and a measure named Parameter value, returns the value selected in parameter.
Lets give the meaningful name to parameter, change the name to Discount as shown below.

Lets take the Sales Data into table Visual as shown below.

Using What-If Parameter in Measure
Lets create a measure named Amount After Discount that will returns the affected sales amount after applying discount, and the discount value will be passed dynamically through slicer using What If parameter.
Amount After Discount =

SUM ( Sales[Amount] )

- ( SUM ( Sales[Amount] ) * Parameter[Parameter Value] ) / 100

Once you commit the DAX, Lets drag it into table visual right to the Amount field.
And you can see, the Default value that set to parameter is 0 so the values in Amount After Discount fields are same as Amount that means 0% discount is applied on sales amount.

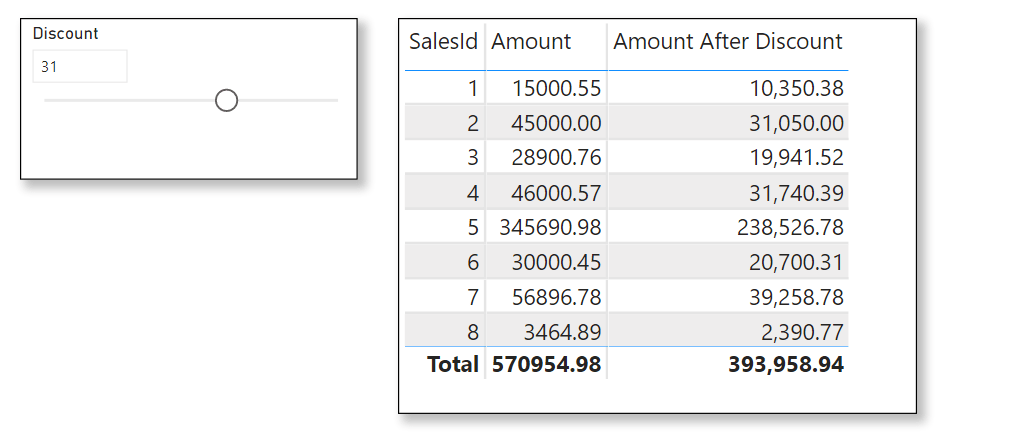
Lets scroll the slider slowly to the right side and set the parameter value to 10 to see the affect on sales Amount after applying 10% discount.

You can see, After setting up the Parameter value on slicer to 10, the 10 % discount is applied on sales amount immediately.
So using What-If parameter you can easily evaluate you data behaviour under different condition by passing values dynamically to the DAX calculation.
Modifying the What-If Parameter
You have created a What If parameter for maximum value 20 so you can not pass discount value more than 20, In case if you want to update the maximum value, minimum, increment value than you can also Edit the Parameter.
Following are the Steps to modifying the What-If parameter.
Go to Data view, then Under Fields Pane, Click on Parameter.
You can see the DAX code for Parameter, It is a GENERATESERIES function Dax.
You can modify it and provide minimum, maximum and increate values.
In the first argument of GENERATESERIES Function, provide a starting value that will be a minimum value that is 1, in second argument provide ending value that will be your maximum value that is 50 and in third argument provide the increment value that is 2.

After modifying the DAX code, commit the Dax and go to report page.
You will see now values in slicer has been changed starting from 1 and that is incremented by 2 up to the maximum value.
Now you can see the affected amount on more than 20 % discount. Lets see the affected sales amount
Also Read..
Implementing Parameters in Power BI
Changing the Data Source dynamically using Parameters
![]()